Market Analysis
Following the departure of the UK on 31 January 2020, the EU consists of 27 member states ‑ Austria*, Belgium*, Bulgaria, Croatia*, Cyprus*, the Czech Republic, Denmark, Estonia*, Finland*, France*, Germany*, Greece*, Hungary, Ireland*, Italy*, Latvia*, Lithuania*, Luxembourg*, Malta*, the Netherlands*, Poland, Portugal*, Romania, Slovakia*, Slovenia*, Spain* and Sweden.
Albania, North Macedonia, Moldova, Montenegro, Serbia, Türkiye and Ukraine are all candidate countries for entry into the EU, with accession negotiations being held to determine their ability to apply EU legislation and examine possible requests for transition periods.
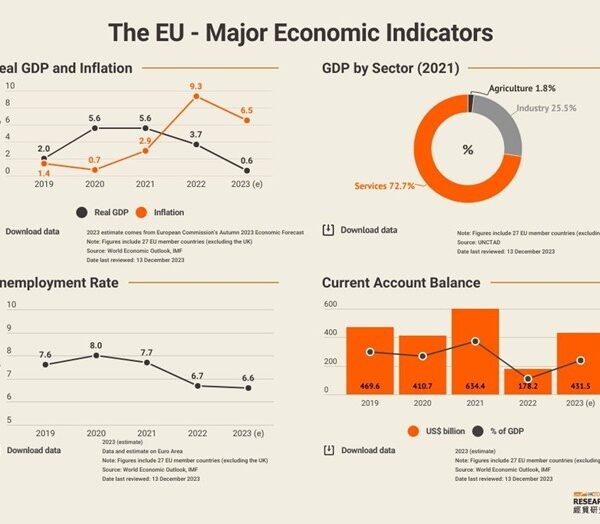
At present, Germany, France, Italy, Spain and the Netherlands boast the largest GDPs among the 27 member states, together accounting for 68% of the bloc’s total in 2023. As of December 2023, 20 member states (marked with an asterisk above) have adopted the euro (€) as their official currency, making up a monetary union called the Eurozone.
The EU in general has shown resilience in economic recovery and skirted a recession. However, interest rates have shot up significantly in an attempt to bring down inflation to 2%, and together with the tightening financial conditions this may discourage consumption and investment in the short term, leading to sluggish economic prospects for the region.
Trade Policies
All EU member states adopt a common external trade policy and trade measures.
Scheme of Generalised Tariff Preferences
The EU’s Generalised Scheme of Preferences (GSP) offers a partial or full removal of import duties for developing countries. By January 2023, GSP had been granted to 65 developing countries. Mainland China was removed from the EU’s GSP on 1 January 2015, while Hong Kong graduated on 1 May 1998. For further information, please click here.
Trade Defence Instruments
Trade remedies, such as anti‑dumping (AD) measures, can be imposed on imports of a product from a country to correct damages suffered by EU companies when manufacturers from a non‑EU country are found to have sold goods in the EU below the sales prices in their domestic market or below the cost of production. These measures are renewable, and can last up to six months in the case of provisional measures or five years in the case of definitive measures.
Anti‑subsidy or countervailing (CV) measures can be imposed on subsidised imports to counteract the trade‑distorting effects of subsidies provided by a non‑EU government to companies to produce or export goods. These measures are also renewable and can run for four months in the case of provisional measures or five years in the case of definitive measures.
Safeguards can be imposed to regulate the imports of a product found to have increased so suddenly and sharply that EU producers cannot reasonably be expected to adapt immediately to the changed trade situation. These measures are renewable, and can stay in place for 200 days in the case of provisional measures or four years in the case of definitive measures.
By the end of 2023, the EU had imposed 69 AD measures and 10 CV measures on goods originating from mainland China, but none on goods originating from Hong Kong. A complete and updated list of EU trade defence measures can be found here, while HKTDC also provides regular updates via Regulatory Alert-EU.
Chemicals Regulations
The Registration, Evaluation, Authorisation and Restriction of Chemicals (REACH) Regulation requires EU manufacturers and importers of chemical substances (whether in a pure form, in preparations or in certain articles) to gather comprehensive information on the properties of such substances and to register them prior to manufacturing in or importing to the EU. Updates on the REACH regulation can be found at the European Chemicals Agency (ECHA)’s website, while HKTDC also provides regular updates via Regulatory Alert-EU.
Deforestation-free Products
The Regulation on deforestation-free products entered into force on 29 June 2023 with the aim to reducing carbon emissions and avoiding deforestation driven by agricultural expansion to produce the commodities in the scope of the regulation. Traders and operators shall exercise due diligence on products within the scope of the regulation and be able to prove that the production of commodities like palm oil, soil, coffee, and others have not contributed to forest degradation nor deforestation. Updates and further details on the deforestation regulations can be found at European Commission’s website.
Other Measures
The EU specifies a high standard of safety, health and environmental protection requirements. Examples include a series of key directives governing electrical and electronic equipment (EEE), most notably the Restriction of Hazardous Substances (RoHS), the Waste Electrical and Electronic Equipment (WEEE), the Ecodesign Directive, the Energy Labelling Directive and the new Single-Use Plastics (SUP) Directive.
According to the RoHS Directive 2011/65/EU, EEE placed on the EU market, other than those exempted by Annexes III or IV of the Directive, must not contain certain hazardous substances in amounts exceeding the following maximum concentration values:
- 0.01 % by weight in homogeneous materials for cadmium.
- 0.1 % by weight in homogeneous materials for lead, mercury, hexavalent chromium, polybrominated biphenyls (PBB), polybrominated diphenyl ethers (PBDE), bis(2-ethyl hexyl) phthalate (DEHP), butyl benzyl phthalate (BBP), dibutyl phthalate (DBP) and diisobutyl phthalate (DIBP).
WEEE Directive 2012/19/EU placed the following requirements on EEE producers selling into the EU market:
- The design and production of EEE must facilitate the re-use, dismantling and recovery of WEEE.
- EEE must be appropriately marked with the symbol shown in Annex IX of the Directive in order to facilitate its separate collection.
- Individual or collective systems for the collection, treatment and recovery of WEEE must be set up, while the recovery targets established by Annex V must be met.
- The financing of the collection, treatment, recovery and sound disposal of waste arising from all products must be guaranteed.
- Information on the re-use and treatment for new EEE must be provided to users and treatment facilities within one year of its introduction to the market.
- Information on EEE introduced to the market, as well as the levels of recycling achieved (as set out in Annex X), must be reported to the competent authority as appointed by the respective EU member.
Ecodesign Directive 2009/125/EC mandates that all energy‑related product (ErP) producers selling into the EU prioritise the minimisation of energy consumption and other environmental impacts when designing products. A more recent extension of the Ecodesign initiative, the Energy Labelling Regulation 2017/1369/EU, requires producers to provide labels for all ErPs. More information can be found here, while HKTDC also provides regular updates via Regulatory Alert-EU.
The new SUP Directive (EU) 2019/904, published on 12 June 2019, requires EU members to transfer it into national law by 3 July 2021. The directive will not only require reduced consumption of single-use food containers and cups but also ban the use of single‑use plastics in cutlery, plates, straws, cotton bud sticks, beverage stirrers and balloon sticks. Manufacturers and importers of related SUP products will also have to bear extra responsibilities with regard to waste management, product design, labeling, and awareness. Further information can be found on the European Commission’s website, while HKTDC also provides regular updates via Regulatory Alert-EU.
Source: European Commission
| Rank | Company Name | Industry | Region | Market Cap (Billion $) | Revenue (Billion $) | Growth Rate (%) | Employees | Country |
|---|---|---|---|---|---|---|---|---|
| 1 | Naspers | Technology | Africa | 70 | 25 | 12.0 | 25,000 | South Africa |
| 2 | MTN Group | Telecommunications | Africa | 20 | 12 | 9.5 | 19,288 | South Africa |
| 3 | Sasol | Energy | Africa | 10 | 15 | 4.2 | 31,270 | South Africa |
| 4 | Anglo American Platinum | Mining | Africa | 30 | 12 | 6.5 | 20,000 | South Africa |
| 5 | Standard Bank Group | Finance | Africa | 17 | 9 | 5.7 | 55,000 | South Africa |
| 6 | Vodacom Group | Telecommunications | Africa | 15 | 8 | 8.3 | 7,554 | South Africa |
| 7 | FirstRand | Finance | Africa | 14 | 7.5 | 4.8 | 44,916 | South Africa |
| 8 | Safaricom | Telecommunications | Africa | 12 | 4.5 | 7.0 | 6,230 | Kenya |
| 9 | Dangote Cement | Manufacturing | Africa | 11 | 2.5 | 6.0 | 30,000 | Nigeria |
| 10 | Absa Group | Finance | Africa | 9 | 6.5 | 4.1 | 40,000 | South Africa |
| Rank | Company Name | Industry | Region | Market Cap (Billion $) | Revenue (Billion $) | Growth Rate (%) | Employees | Country |
|---|
| 1 | Vale | Mining | South America | 85 | 40 | 7.0 | 75,000 | Brazil |
| 2 | Petrobras | Energy | South America | 65 | 90 | 5.4 | 57,000 | Brazil |
| 3 | Itaú Unibanco | Finance | South America | 55 | 25 | 4.5 | 100,335 | Brazil |
| 4 | Banco Bradesco | Finance | South America | 45 | 18 | 3.9 | 98,800 | Brazil |
| 5 | América Móvil | Telecommunications | South America | 50 | 52 | 8.0 | 190,000 | Mexico |
| 6 | Grupo Bimbo | Food & Beverage | South America | 20 | 18 | 4.2 | 138,000 | Mexico |
| 7 | Grupo Aval Acciones y Valores | Finance | South America | 12 | 6.5 | 4.3 | 81,000 | Colombia |
| 8 | Grupo Argos | Cement/Infrastructure | South America | 7.5 | 4 | 5.1 | 14,600 | Colombia |
| 9 | YPF | Energy | South America | 6.5 | 15 | 4.7 | 18,300 | Argentina |
| 10 | LATAM Airlines Group | Aviation | South America | 2.5 | 10 | 3.5 | 42,000 | Chile |
| Rank | Company Name | Industry | Region | Market Cap (Billion $) | Revenue (Billion $) | Growth Rate (%) | Employees | Country |
|---|
| 1 | Apple | Technology | North America | 2,800 | 365 | 6.7 | 160,000 | USA |
| 2 | Microsoft | Technology | North America | 2,500 | 200 | 11.4 | 190,000 | USA |
| 3 | Amazon | E-Commerce/Tech | North America | 1,600 | 469 | 9.4 | 1,540,000 | USA |
| 4 | Alphabet (Google) | Technology | North America | 1,800 | 257 | 13.2 | 190,234 | USA |
| 5 | Berkshire Hathaway | Finance | North America | 690 | 276 | 5.9 | 360,000 | USA |
| 6 | Tesla | Automotive | North America | 800 | 81 | 24.3 | 110,000 | USA |
| 7 | Johnson & Johnson | Healthcare | North America | 470 | 94 | 3.8 | 150,000 | USA |
| 8 | Meta Platforms (Facebook) | Technology | North America | 750 | 116 | 10.0 | 87,000 | USA |
| 9 | Visa | Finance | North America | 500 | 29 | 8.0 | 21,500 | USA |
| 10 | Procter & Gamble | Consumer Goods | North America | 350 | 82 | 4.5 | 101,000 | USA |
| Rank | Company Name | Industry | Region | Market Cap (Billion $) | Revenue (Billion $) | Growth Rate (%) | Employees | Country |
|---|---|---|---|---|---|---|---|---|
| 1 | Tencent | Technology | Asia-Pacific | 470 | 86 | 14.0 | 112,000 | China |
| 2 | Alibaba | E-Commerce | Asia-Pacific | 270 | 134 | 20.3 | 251,000 | China |
| 3 | Samsung Electronics | Technology | Asia-Pacific | 400 | 230 | 9.8 | 287,000 | South Korea |
| 4 | Toyota Motor Corporation | Automotive | Asia-Pacific | 290 | 275 | 6.7 | 366,000 | Japan |
| 5 | Reliance Industries | Energy/Telecom | Asia-Pacific | 210 | 100 | 12.5 | 236,000 | India |
| 6 | Taiwan Semiconductor | Technology | Asia-Pacific | 510 | 70 | 15.5 | 50,000 | Taiwan |
| 7 | China Construction Bank | Finance | Asia-Pacific | 200 | 160 | 5.5 | 350,000 | China |
| 8 | Sony | Technology | Asia-Pacific | 130 | 85 | 7.3 | 109,000 | Japan |
| 9 | Mitsubishi UFJ Financial | Finance | Asia-Pacific | 110 | 68 | 4.2 | 160,000 | Japan |
| 10 | ICBC | Finance | Asia-Pacific | 280 | 215 | 6.2 | 430,000 | China |
| Rank | Company Name | Industry | Region | Market Cap (Billion $) | Revenue (Billion $) | Growth Rate (%) | Employees | Country |
|---|---|---|---|---|---|---|---|---|
| 1 | LVMH | Luxury Goods | Europe | 480 | 79 | 15.0 | 150,000 | France |
| 2 | Shell | Energy | Europe | 200 | 388 | 6.5 | 87,000 | Netherlands/UK |
| 3 | Nestlé | Consumer Goods | Europe | 340 | 95 | 4.8 | 273,000 | Switzerland |
| 4 | ASML | Technology | Europe | 250 | 23 | 25.0 | 31,000 | Netherlands |
| 5 | Roche | Healthcare | Europe | 300 | 68 | 5.7 | 101,000 | Switzerland |
| 6 | Volkswagen Group | Automotive | Europe | 130 | 280 | 7.5 | 662,000 | Germany |
| 7 | SAP | Technology | Europe | 150 | 32 | 8.9 | 102,000 | Germany |
| 8 | Unilever | Consumer Goods | Europe | 130 | 60 | 3.5 | 148,000 | UK |
| 9 | TotalEnergies | Energy | Europe | 140 | 184 | 4.2 | 100,000 | France |
| 10 | Airbus | Aerospace | Europe | 110 | 78 | 5.3 | 127,000 | France/Germany |
| Rank | Company Name | Industry | Region | Market Cap (Billion $) | Revenue (Billion $) | Growth Rate (%) | Employees | Country |
|---|---|---|---|---|---|---|---|---|
| 1 | Apple | Technology | North America | 2,800 | 365 | 6.7 | 160,000 | USA |
| 2 | Saudi Aramco | Energy | Middle East | 2,000 | 400 | 10.2 | 79,000 | Saudi Arabia |
| 3 | Microsoft | Technology | North America | 2,500 | 200 | 11.4 | 190,000 | USA |
| 4 | Alphabet (Google) | Technology | North America | 1,800 | 257 | 13.2 | 190,234 | USA |
| 5 | Amazon | Retail/Tech | North America | 1,600 | 469 | 9.4 | 1,540,000 | USA |
| 6 | Tesla | Automotive | North America | 800 | 81 | 24.3 | 110,000 | USA |
| 7 | Berkshire Hathaway | Finance | North America | 690 | 276 | 5.9 | 360,000 | USA |
| 8 | Tencent | Technology | Asia-Pacific | 470 | 86 | 14.0 | 112,000 | China |
| 9 | Johnson & Johnson | Healthcare | North America | 470 | 94 | 3.8 | 150,000 | USA |
| 10 | Samsung Electronics | Technology | Asia-Pacific | 400 | 230 | 9.8 | 287,000 | South Korea |


